

The pie charts show the breakdown of the SEF answers.
Overall Breakdown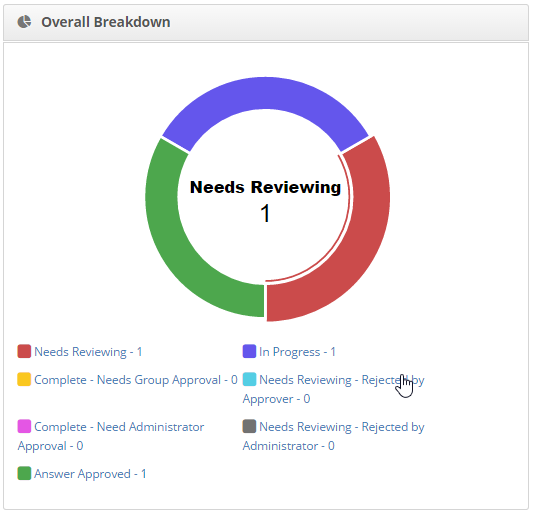
This shows the overall progress of the SEF. Click on a section of the pie chart to view the underlying questions.
Section Breakdown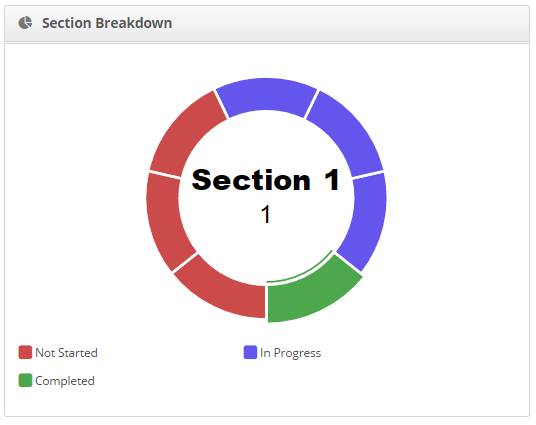
This pie chart shows the progress of the SEF by section. Hover the mouse over the chart to view the section names. Click on the section to view the underlying questions.