Overview
The iP system enables you to create reports of the data you have access to. We shall be looking at some screens which facilitate the creation of reports, but throughout the system there are Export buttons which enable you to export out of the system and into a Word document, an Excel spreadsheet or a PDF file the data on your screen. In addition the header often has export or print options in the top right.
Instructions
Suppose you wish to create a spreadsheet listing the monitoring you need to perform in the current academic year. You can obtain this data from your My Staff page. The lower area of this page should be similar to this:

Practical Task:
- Select My Work from the left-hand contents menu then select My Staff from the expanded list
- Scroll down to the My Staff’s Monitoring section to see the list of planned monitoring for your staff
- To generate a report of this information click on the grey Export button on the right-hand side of the screen
Notice that when you click the Export button you get a popup window for you to specify the type of report and the data to be included.

Practical Task:
-
Go to the Type tab and select Excel
-
Go to the Data tab and leave all the columns ticked
-
Click the Export button
-
Check a spreadsheet file called Monitoring.xls is created
-
Open it and check it looks something like the one below

Wherever you see an Export button within the iP system, you should be able to generate an external report in the same way as shown here. If you do not require all the information you can remove ticks against certain columns.
Various reporting pages are available under the contents item My Work. We shall look at the Monitoring page first.
Practical Task:
- From the My Work contents item select Monitoring from the expanded list
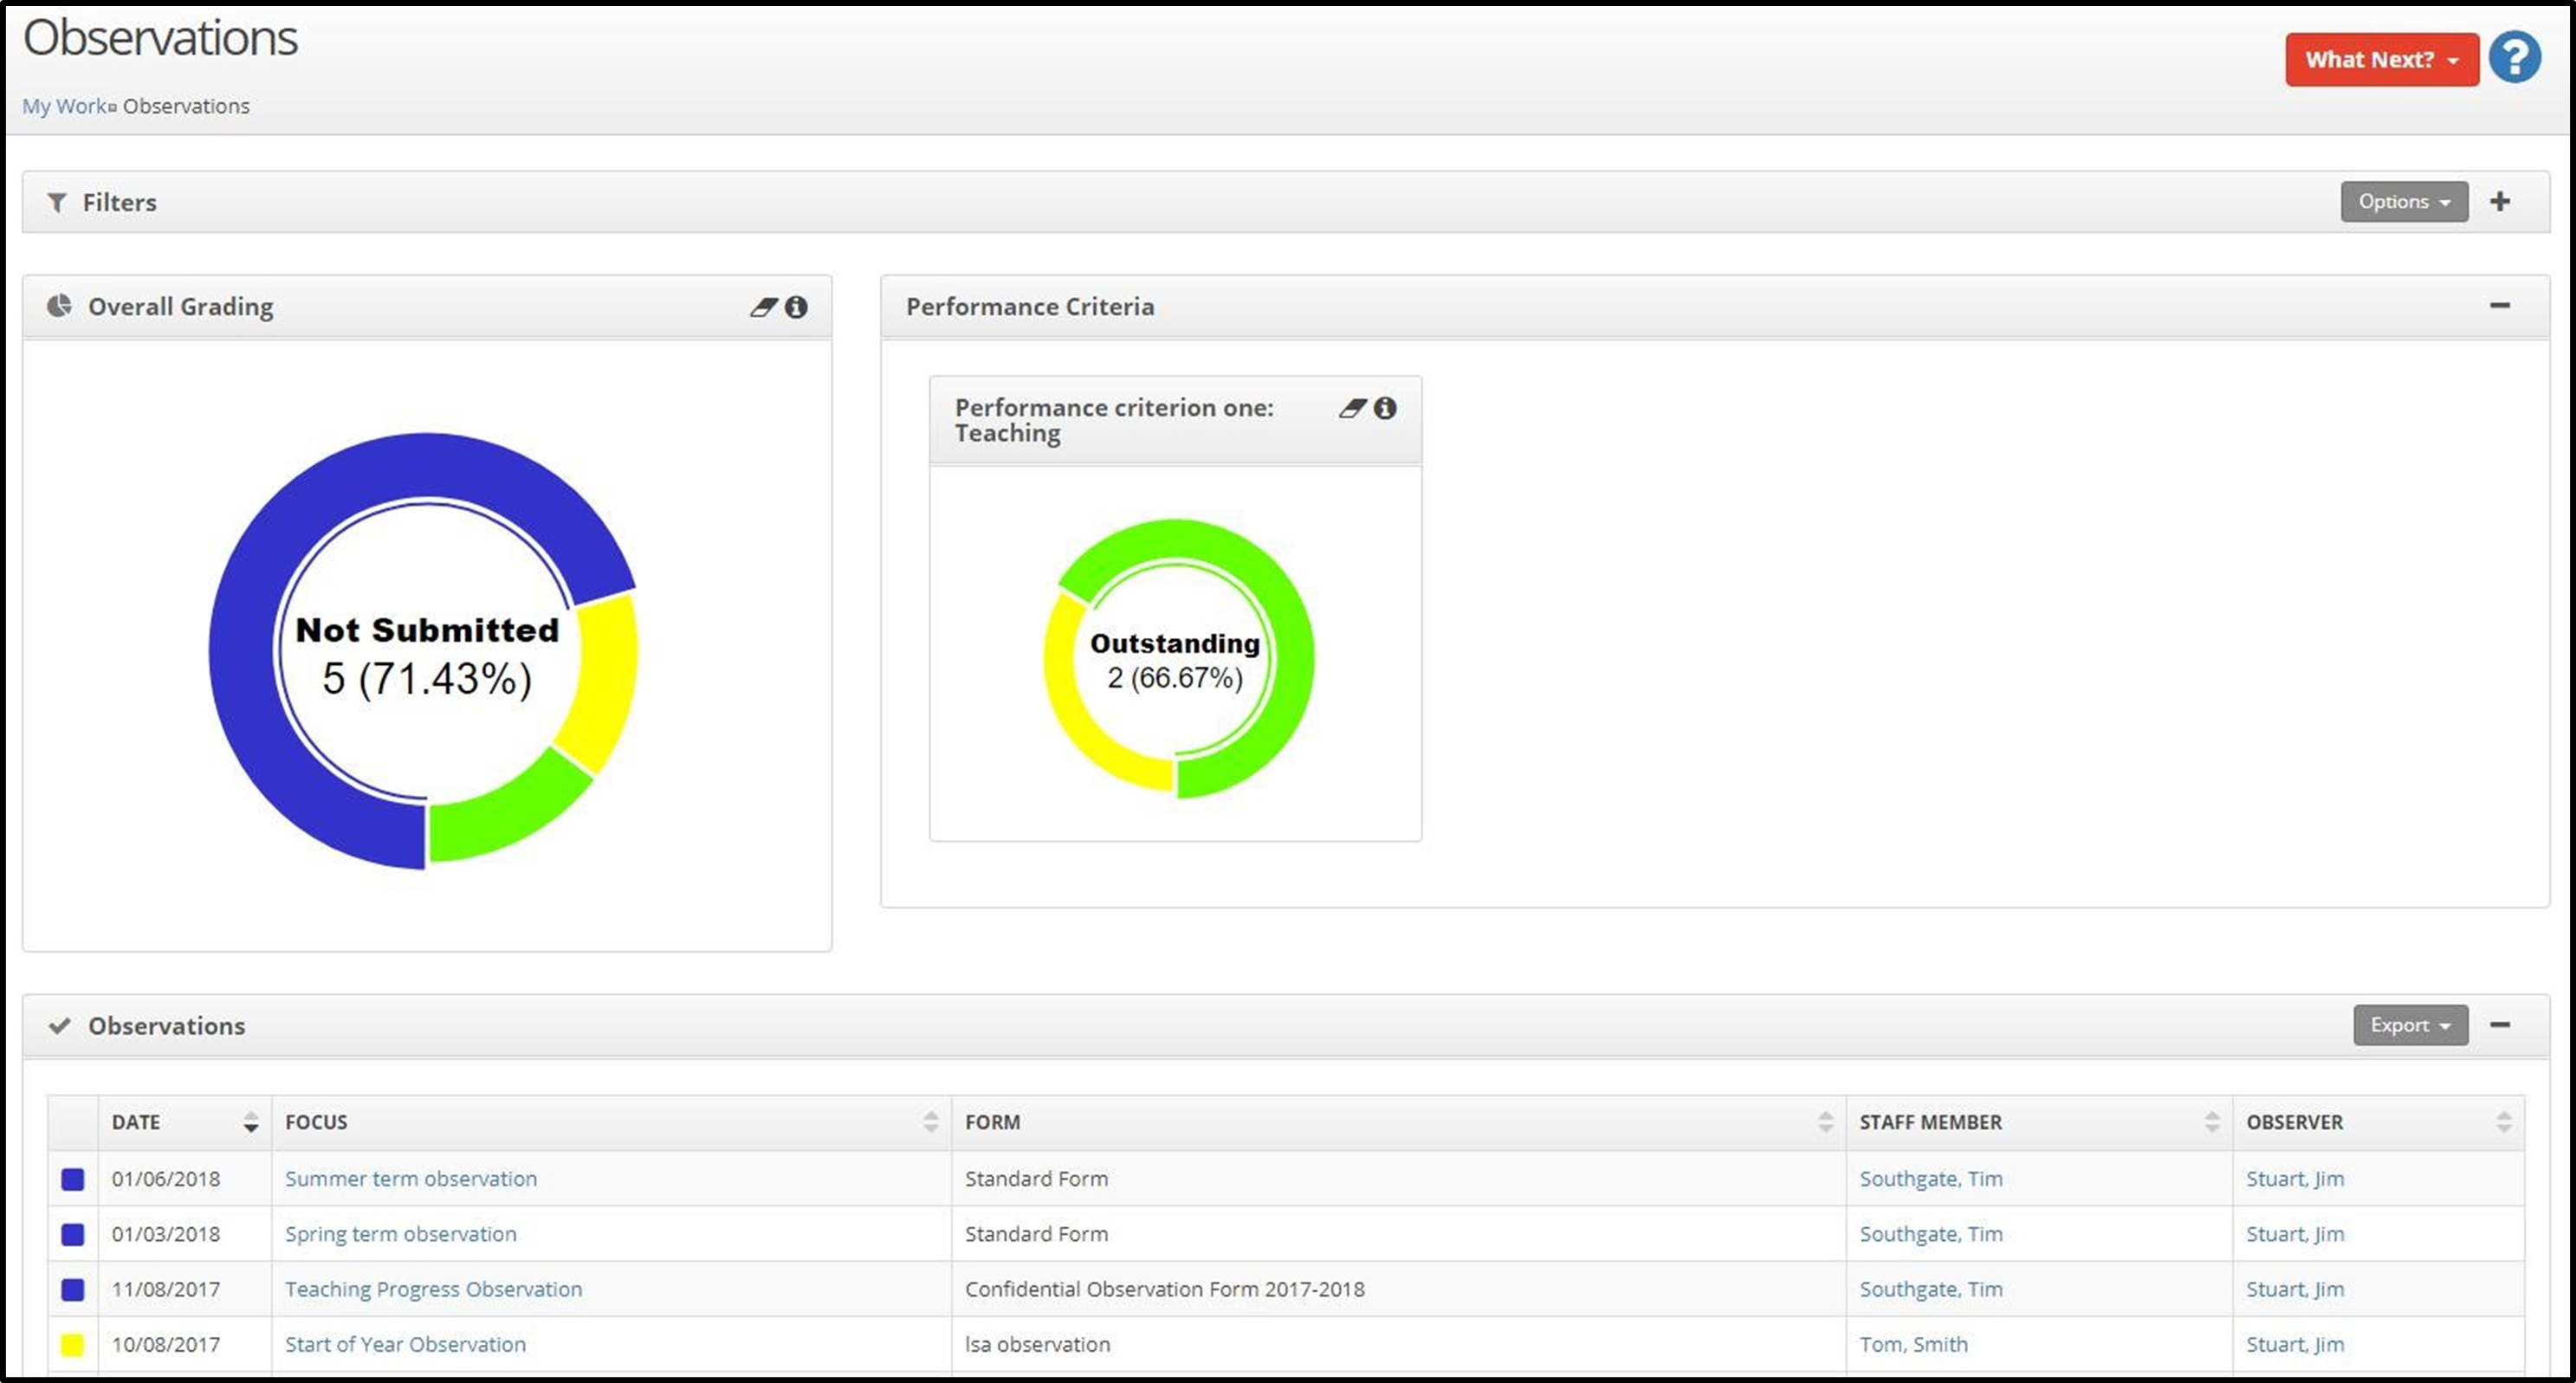
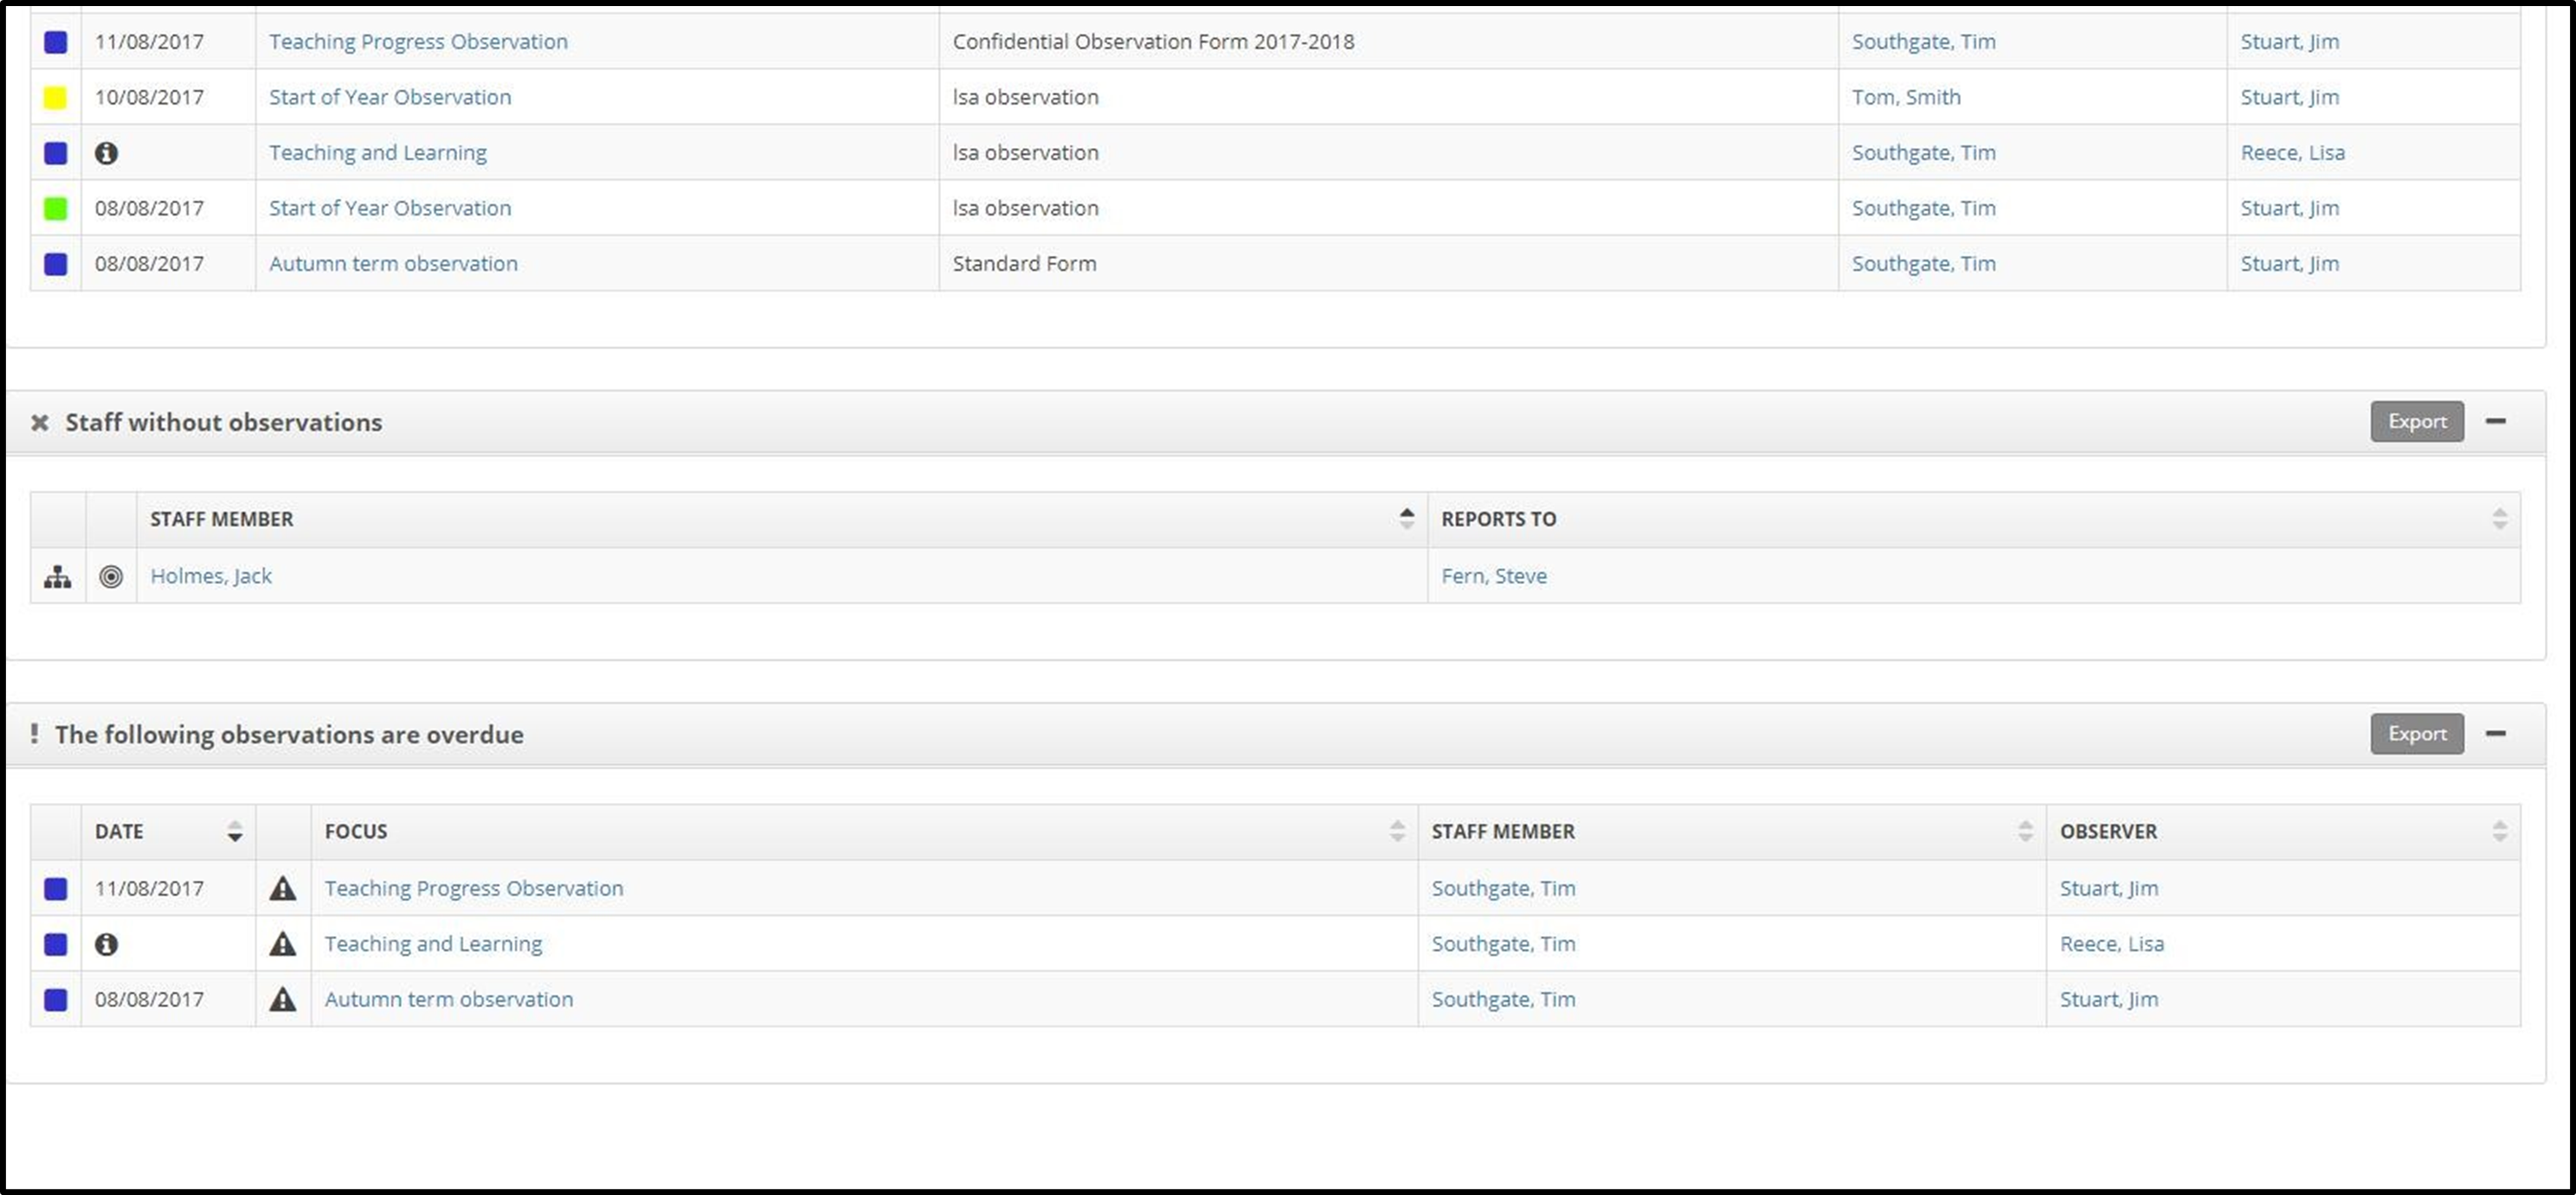
Notice this page has five sections:
A filters section at the top of the page which enables you to filter the information displayed on the page
A graphics section with two circular graphs summarising outcomes
A Monitoring section listing all completed monitoring in the date range
A list of staff who have not been monitored during the date range
Finally a list of planned monitoring which is now overdue
Notice also there are three Export buttons on this page, one for each of the separate categories: completed monitoring, staff without monitoring and overdue monitoring.
What you see should be similar to these screenshots.
Top section of the screen:

Bottom section of the screen:

Practical Task:
-
At the top of the Monitoring page, click the plus icon (+) on the Filters row
-
Click within the Filter text box to see your filter options.
-
Select Staff Member
-
Click within the Value text box and select one member of staff
-
Click the Search and monitor how the data is filtered down
-
Note the Date From and Date To dates are defaulted to the current academic year.
-
Change these dates and then click Search to see how the information changes
-
Click on the Options dropdown and select Save Filter
- Give your filter a title
You should now have an extra text box called Saved Filter with the filter you just saved listed in the dropdown. Selecting Please select a filter … from the dropdown will restore the default screen without a filter.
We shall now move to the Staff Objectives report page.
Practical Task:
1. From the My Work contents item select Staff Objectives from the expanded list.
Notice:
The page is very similar to the Monitoring page with the filters functionality at the top and the circular graphs under the filter section
There are two data sections on this page, first completed objectives and second a list of staff without completed objectives within the date range
We shall now move to the Standards report page.
Practical Task:
1. From the My Work contents item select Standards from the expanded list
Notice:
Against the look and feel of this page is very similar to the previous two we have just looked at
There are three graphs on this page for reviewee rating, reviewer rating and one showing all standards with their ratings profile
The information icon (i) next to each graph can be used to explain the colouring and give further statistics
If you click on one of the coloured blocks in the reviewee rating or reviewer rating circular graphs then the list of standards in the section below is filtered to that rating
The Clear Filters icon can be clicked to clear the filtering on specific ratings
The standards area in the lower area of the screen lists all current standards for all staff you have access to
As you have seen this long list can be filtered in various ways Finally we shall look at the Pay Progression report page.
Practical Task:
- From the My Work contents item select Pay Progression from the expanded list.
Notice:
This page functions like the other reporting pages
The Export button allows you to export the data
Ticking the Anonymise Data checkbox enables you to generate a report without staff names
Next Steps


